Create a server monitoring agent
To monitor your server's resources, we offer, by default, a Python script designed to collect and send information about your server's usage.
Using this script and the documentation below, you will be able to create your own tool for collecting and sending data.
- Summary
- Prerequisite
- Authentication
- Query data
- API Responses
- Reports
Prerequisite
The script you are going to create will have to send your server's information to our API on a regular basis in order to allow the monitoring of your server.
Here are the necessary data to enable communication with the PLC:
- URL: https://hitflow.net/agent/v1/report
- Server login: available in your manager
- Authentication token: available in your manager
First of all, you will need to create a server in your manager to generate a server ID and an authentication token.
Request Authentication
Once you have validated the creation of the server in your manager, you will find at the bottom of the form a block named "Server Agent". This block will contain all the necessary information to authenticate a request.
Header
The authentication of a request is done by defining two attributes in its header.
| Attribute name | Value of the attribute |
|---|---|
| HitFlow-Agent-Server | Server ID |
| HitFlow-Agent-Token | Authentication token |
Error management
If there is a problem with the authentication of the request, one of the errors below will be returned:
| Code | Reason |
|---|---|
| 10000 | Unauthorized access because the authentication headers were not found. |
| 22036 | Invalid server identifier or authentication token. |
Data structure
The script you have developed must send all information about the server in a JSON-formatted object.
General structure
Below is a list of the top-level attributes and their type, which can be an object, the description of which is defined below:
| Name | Type | Limitations | Comment |
|---|---|---|---|
| operating_system | String | Length from 1 to 32 characters | String indicating the name of the OS |
| uptime | Int | Value between 0 and 157680000 | Number of seconds since server startup |
| load_average | Float[3] | Table of 3 floats ranging from 0 to 100 | Server system load |
| cpu | Float | Server CPU usage | documentation/agent-server.text-424 |
| memory | Memory | Server RAM Memory Information | |
| swap | Memory | Server exchange file information | |
| storage | Storage[32] | Table of 1 to 32 "Storage" type objects | Disk Status Information |
| process | Process[100] | Table type "Process" from 0 to 100 objects. | List of 100 active processes on the server |
Look out! Current limits are subject to change.
Subscribe to the "technical" newsletter in your account to receive alerts when a change in operation is planned.
Memory type object
Objects of type "Memory" are used to describe the state of the server's memory.
| Name | Type | Limitations | Comment |
|---|---|---|---|
| available | Int | Value between 0 and 1048576 | Total available memory space in MB |
| total | Int | Value between 0 and 1048576 | Total available memory size in MB |
| used | Int | Value between 0 and 1048576 | Total memory used in MB |
Storage type object
Les objets de type "Storage" sont utilisés pour décrire l'utilisation des volumes du serveur.
| Name | Type | Limitations | Comment |
|---|---|---|---|
| name | String | String from 1 to 256 characters | Name of storage volume |
| total | Int | Value between 0 and 1048576 | Total volume capacity expressed in GB |
| used | Int | Value between 0 and 1048576 | Total size used on the volume in GB |
Object of type "Process"
Objects of type "Process" are used to describe a process running on a server.
| Index | Type | Limitations | Comment |
|---|---|---|---|
| 0 | String | String from 1 to 96 characters | Name of the process |
| 1 | String | String from 1 to 48 characters | User executing the process |
| 3 | Float | Value between 0 and 100 | Percentage of CPU usage by process |
| 4 | Int | Value between 0 and 1048576 | Process memory consumption in MB |
API Response
When your script passes the information to the API, you will need to process a JSON object with an "error" attribute and an "msg" attribute.
{"error":0,"msg":"OK"}
The table below lists the error codes that can be returned under certain conditions:
| Code | Description |
|---|---|
| 0 | The report was successfully received and processed |
| 21101 | One or more values are invalid and the "input" attribute gives details of the errors to be corrected. |
| 22037 | The sending time between two reports is too short (see the configuration in your manager) |
| 22038 | Monitoring of this server has been disabled and no reports will be logged |
Report Analysis
By going to the server's report page, from your manager, you can consult the list of requests sent by your script in the "Reports" tab.
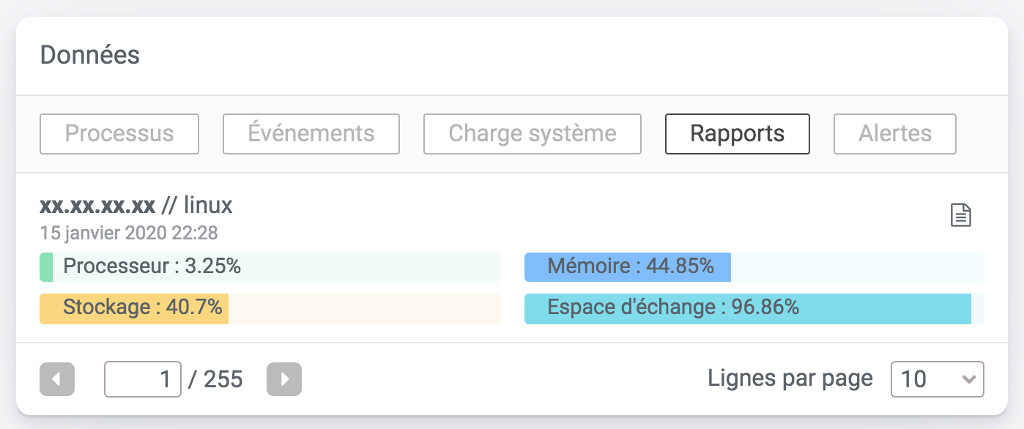
By clicking on the detail button (), you will display different information such as the data sent by your script or the response returned by our API.